
Following the availability of free tools to analyze financial markets based on data, this insight highlights a document published by JP Morgan Asset Management.
The English version is freely accessible, while the Italian version requires registration. This discussion will therefore focus on the English version, which can be downloaded here:
The report is a document of about 100 pages, updated quarterly, containing summary information—mainly in graphical format—on macroeconomic data (e.g., GDP, inflation, population) and market data (e.g., equities, bonds, commodities).
Below is a brief excerpt to address the questions I have recently received most often and to understand if there are potential bubbles and/or opportunities in financial markets. For the more curious and analytical, I recommend reading the entire report as it offers a fairly comprehensive overview of the markets in an accessible format.
Figure 1 shows the GDP growth in major world countries (left) and their share of global GDP (right).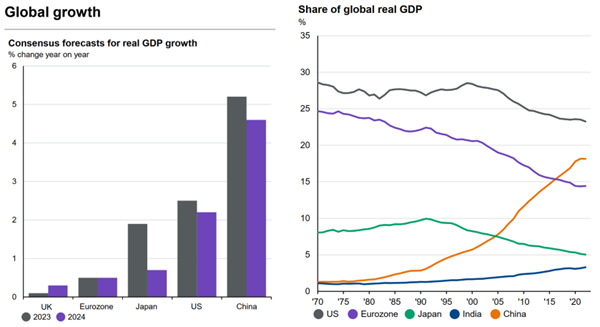
Figure 1 – Global GDP growth and percentage of global GDP of major countries. Source: Guide to the Markets, Europe 2Q 2024 (as of 31 March 2024), JP Morgan Asset Management
In the graph on the left, it is noted that among the major global markets, China has a GDP growth rate exceeding 5% per year in 2023 (dark bar), higher than that of the United States (about 2.5%), Japan (about 1.9%), and the Eurozone (about 0.5%) [1]. This growth rate is lower than the historical average, and it remains unlikely that China’s GDP growth could return to rates above 10%: this is physiological as the GDP growth rate tends to decrease as the economy grows in size.
The graph on the right shows how China has become the number two globally in terms of GDP (about 18% of global GDP versus the United States at 23%), following very high growth in previous years.
Figure 2 shows the annual inflation data, on a monthly basis, over the past two years in various countries. It is easy to see how, even following the rate hikes by central banks, inflation has fallen in almost all the countries considered. On average, current inflation is in the 2-3% range, with particularly low values in Italy (0.8%) and China (0.7%). In the latter country, an accommodative monetary policy is reasonable to expect, while Italy will probably have to wait for lower inflation in the Eurozone, currently at +2.6% (and above the 2% target of the European Central Bank), before witnessing less restrictive monetary policies.
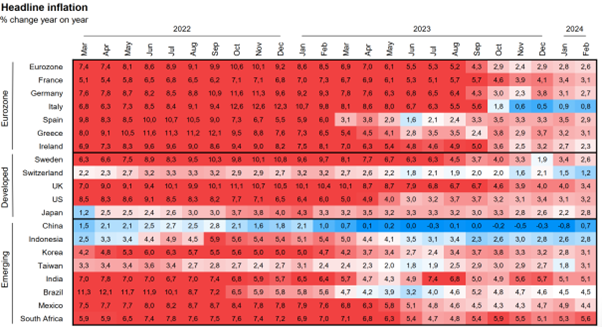
Figure 2 – Global inflation. Source: Guide to the Markets, Europe 2Q 2024 (as of 31 March 2024), JP Morgan Asset Management
With these general premises, one can move on to the evaluations of global equity markets to understand whether they are more or less attractive compared to their history.
Figure 3 presents forward P/E ratios, i.e., the ratio between the price of shares and their earnings (estimated): a high ratio tends to indicate a bubble, and vice versa.
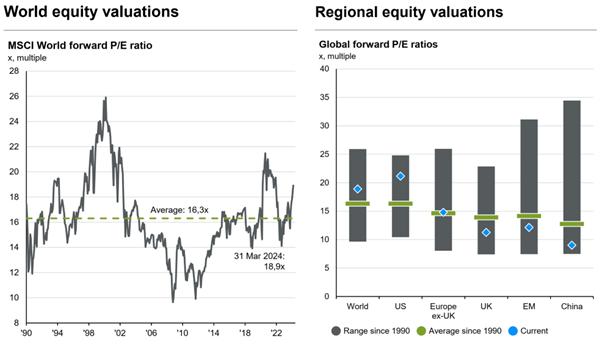
Figure 3 – Equity markets: valuations (forward P/E ratios). Source: Guide to the Markets, Europe 2Q 2024 (as of 31 March 2024), JP Morgan Asset Management
The graph on the left is based on data from global equity markets, excluding emerging markets. In aggregate, the forward P/E ratio of the MSCI World index (where the United States accounts for about 70%) now stands at 18.9x (vs an average of 16.3x).
While this ratio does not necessarily indicate a bubble, being slightly above the historical average, the table on the right indicates how the forward P/E of the US market is particularly high (forward P/E above 20%) compared to other markets. The valuations of European equity markets are in line with their average (forward P/E around 15x), while the UK, emerging markets in aggregate, and China (part of the emerging markets) offer discounted prices, below their historical average. China offers the most interesting valuations in terms of forward P/E ratio as the Chinese stock market has lost more than 40% of its value in the last 3 years [2].
Analyzing the bond market, it is easy to see how the context has changed radically in recent months. Following the restrictive monetary policies that have occurred since 2022, bonds today offer positive and significantly more attractive yields to maturity for those approaching to invest in this asset class.
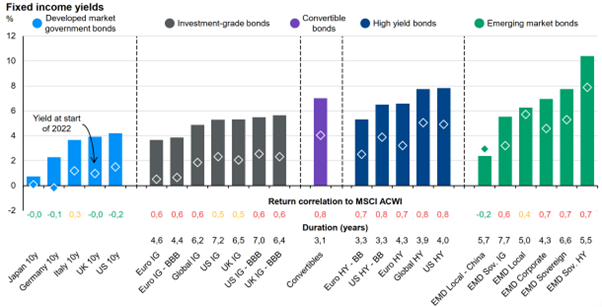
Figure 4 – Yields to maturity, global bonds. Source: Guide to the Markets, Europe 2Q 2024 (as of 31 March 2024), JP Morgan Asset Management
In Figure 4, it can be seen how all bonds are able to offer, over horizons of 5 to 10 years, positive annual yields to maturity (and generally above 2% gross annual). From left to right, data for the following bonds are reported: global government bonds; corporate (investment grade, i.e., with contained default risk); convertibles; high yield or “junk bonds” (with significant default risk); emerging markets (of various types).
This market context seems more consistent with classical finance principles, according to which those who lend money should generally expect to be compensated (let’s not forget that until about 2 years ago, for almost 10 years, the yields to maturity of the least risky bonds, such as the German Bund, were negative!).
Finally, in Figure 5, the expected annual returns (over 10-15 year horizons) of a series of financial instruments (stocks and bonds) are indicated. The estimates, as such, should be taken with a grain of salt, meaning they will never be accurate, and it is no coincidence that they are published only for very long time horizons. Leaving aside the magnitude of the estimated annual return, it is worth focusing on the ordering of asset classes based on yield. The expected returns reflect the current market valuations relative to their history, tending to favor the asset classes that have fallen the most in recent years and could therefore offer an interesting entry point for the investor looking to revise their portfolio exposures [3].
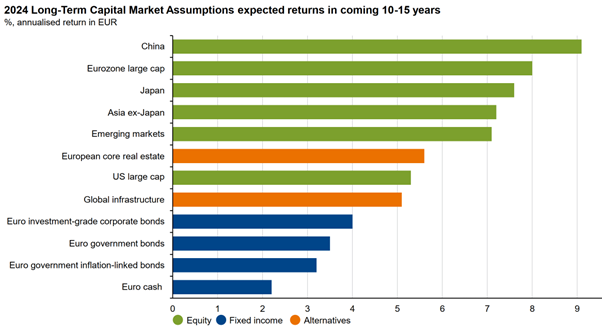
Figure 5 – Estimated market returns. Source: Guide to the Markets, Europe 2Q 2024 (as of 31 March 2024), JP Morgan Asset Management
[1] For a complete list of global GDP, refer to the World Bank website: World Bank GDP Data
[2] For a view of the historical performance of equity markets, refer to the following insight: How to Evaluate an Equity Fund
[3] For further considerations on expected returns, refer to the following insight: Expected Returns Today